Section 1.10 : Common Graphs
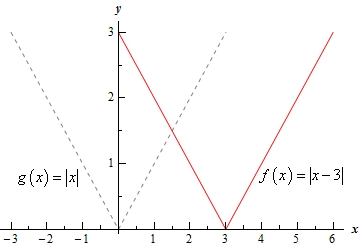
2. Without using a graphing calculator sketch the graph of \(f\left( x \right) = \left| {x - 3} \right|\).
Show Solution
Recall the basic Algebraic transformations. If we know the graph of \(g\left( x \right)\) then the graph of \(g\left( {x + c} \right)\) is simply the graph of \(g\left( x \right)\) shifted right by \(c\) units if \(c < 0\) or shifted left by \(c\) units if \(c > 0\).
So, in our case if \(g\left( x \right) = \left| x \right|\) we can see that,
\[f\left( x \right) = \left| {x - 3} \right| = g\left( {x - 3} \right)\]and so the graph we’re being asked to sketch is the graph of the absolute value function shifted right by 3 units.
Here is the graph of \(f\left( x \right) = \left| {x - 3} \right|\) and note that to help see the transformation we have also sketched in the graph of \(g\left( x \right) = \left| x \right|\).