Section 4.5 : The Shape of a Graph, Part I
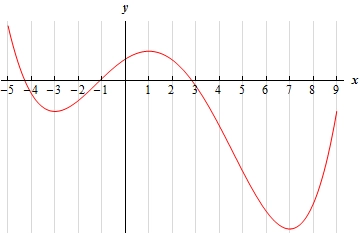
1. The graph of a function is given below. Determine the intervals on which the function increases and decreases.
Show Solution
Solution
There really isn’t too much to this problem. We can easily see from the graph where the function is increasing/decreasing and so all we need to do is write down the intervals.
\[\require{bbox} \bbox[2pt,border:1px solid black]{{{\mbox{Increasing : }} \left( { - 3,1} \right)\,\,\,\ \& \,\,\,\left( {7,\infty } \right)\hspace{0.25in}\hspace{0.25in}{\mbox{Decreasing : }} \left( { - \infty , - 3} \right)\,\,\,\, \& \,\,\,\,\left( {1,7} \right)}}\]Note as well that we don’t include the end points in the interval. For this problem that is important because at the end points we are at infinity or the function is either not increasing or decreasing.