Section 4.5 : The Shape of a Graph, Part I
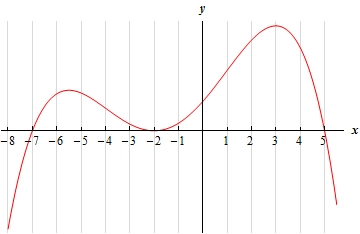
3. Below is the graph of the derivative of a function. From this graph determine the intervals in which the function increases and decreases.
Show Solution
We have to be careful and not do this problem as we did the first two practice problems. The graph given is the graph of the derivative and not the graph of the function. So, the answer is not just where the graph is increasing or decreasing.
Instead we need to recall that the sign of the derivative tells us where the function is increasing and decreasing. If the derivative is positive (i.e. its graph is above the \(x\)-axis) then the function is increasing and if the derivative is negative (i.e. its graph is below the \(x\)-axis) then the function is decreasing.
So, it is fairly clear where the graph is above/below the \(x\)-axis and so we have the following intervals of increase/decrease.
\[\require{bbox} \bbox[2pt,border:1px solid black]{{{\mbox{Increasing : }}\left( { - 7, - 2} \right)\,\,\,\,\& \,\,\,\left( { - 2,5} \right)\hspace{0.25in}\hspace{0.25in}{\mbox{Decreasing : }}\,\,\left( { - \infty , - 7} \right)\,\,\,\,\,\,\& \,\,\,\,\,\left( {5,\infty } \right)}}\]