Section 2.2 : The Limit
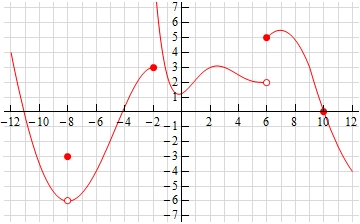
5. Below is the graph of \(f\left( x \right)\). For each of the given points determine the value of \(f\left( a \right)\) and \(\mathop {\lim }\limits_{x \to a} f\left( x \right)\). If any of the quantities do not exist clearly explain why.
- \(a = - 8\)
- \(a = - 2\)
- \(a = 6\)
- \(a = 10\)
a \(a = - 8\) Show Solution
From the graph we can see that,
\[\require{bbox} \bbox[2pt,border:1px solid black]{{f\left( { - 8} \right) = - 3}}\]because the closed dot is at the value of \(y = - 3\).
We can also see that as we approach \(x = - 8\) from both sides the graph is approaching the same value, -6, and so we get,
\[\require{bbox} \bbox[2pt,border:1px solid black]{{\mathop {\lim }\limits_{x \to - 8} f\left( x \right) = - 6}}\]Always recall that the value of a limit does not actually depend upon the value of the function at the point in question. The value of a limit only depends on the values of the function around the point in question. Often the two will be different.
b \(a = - 2\) Show Solution
From the graph we can see that,
\[\require{bbox} \bbox[2pt,border:1px solid black]{{f\left( { - 2} \right) = 3}}\]because the closed dot is at the value of \(y = 3\).
We can also see that as we approach \(x = - 2\) from both sides the graph is approaching different values (3 from the left and doesn’t approach any value from the right). Because of this we get,
\[\require{bbox} \bbox[2pt,border:1px solid black]{{\mathop {\lim }\limits_{x \to - 2} f\left( x \right)\,\,\,{\mbox{does not exist}}}}\]Always recall that the value of a limit does not actually depend upon the value of the function at the point in question. The value of a limit only depends on the values of the function around the point in question. Often the two will be different.
c \(a = 6\) Show Solution
From the graph we can see that,
\[\require{bbox} \bbox[2pt,border:1px solid black]{{f\left( 6 \right) = 5}}\]because the closed dot is at the value of \(y = 5\).
We can also see that as we approach \(x = 6\) from both sides the graph is approaching different values (2 from the left and 5 from the right). Because of this we get,
\[\require{bbox} \bbox[2pt,border:1px solid black]{{\mathop {\lim }\limits_{x \to 6} f\left( x \right)\,\,\,{\mbox{does not exist}}}}\]Always recall that the value of a limit does not actually depend upon the value of the function at the point in question. The value of a limit only depends on the values of the function around the point in question. Often the two will be different.
d \(a = 10\) Show Solution
From the graph we can see that,
\[\require{bbox} \bbox[2pt,border:1px solid black]{{f\left( {10} \right) = 0}}\]because the closed dot is at the value of \(y = 0\).
We can also see that as we approach \(x = 10\) from both sides the graph is approaching the same value, 0, and so we get,
\[\require{bbox} \bbox[2pt,border:1px solid black]{{\mathop {\lim }\limits_{x \to 10} f\left( x \right) = 0}}\]