Section 4.2 : Parabolas
In this section we want to look at the graph of a quadratic function. The most general form of a quadratic function is,
\[f\left( x \right) = a{x^2} + bx + c\]The graphs of quadratic functions are called parabolas. Here are some examples of parabolas.
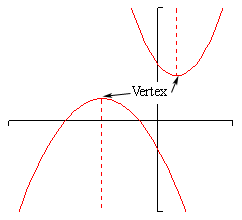
All parabolas are vaguely “U” shaped and they will have a highest or lowest point that is called the vertex. Parabolas may open up or down and may or may not have \(x\)-intercepts and they will always have a single \(y\)-intercept.
Note as well that a parabola that opens down will always open down and a parabola that opens up will always open up. In other words, a parabola will not all of a sudden turn around and start opening up if it has already started opening down. Similarly, if it has already started opening up it will not turn around and start opening down all of a sudden.
The dashed line with each of these parabolas is called the axis of symmetry. Every parabola has an axis of symmetry and, as the graph shows, the graph to either side of the axis of symmetry is a mirror image of the other side. This means that if we know a point on one side of the parabola we will also know a point on the other side based on the axis of symmetry. We will see how to find this point once we get into some examples.
We should probably do a quick review of intercepts before going much farther. Intercepts are the points where the graph will cross the \(x\) or \(y\)-axis. We also saw a graph in the section where we introduced intercepts where an intercept just touched the axis without actually crossing it.
Finding intercepts is a fairly simple process. To find the \(y\)-intercept of a function \(y = f\left( x \right)\) all we need to do is set \(x = 0\) and evaluate to find the \(y\) coordinate. In other words, the \(y\)-intercept is the point \(\left( {0,f\left( 0 \right)} \right)\). We find \(x\)-intercepts in pretty much the same way. We set \(y = 0\) and solve the resulting equation for the \(x\) coordinates. So, we will need to solve the equation,
\[f\left( x \right) = 0\]Now, let’s get back to parabolas. There is a basic process we can always use to get a pretty good sketch of a parabola. Here it is.
Sketching Parabolas
- Find the vertex. We’ll discuss how to find this shortly. It’s fairly simple, but there are several methods for finding it and so will be discussed separately.
- Find the \(y\)-intercept, \(\left( {0,f\left( 0 \right)} \right)\).
- Solve \(f\left( x \right) = 0\) to find the \(x\) coordinates of the \(x\)-intercepts if they exist. As we will see in our examples we can have 0, 1, or 2 \(x\)-intercepts.
- Make sure that you’ve got at least one point to either side of the vertex. This is to make sure we get a somewhat accurate sketch. If the parabola has two \(x\)-intercepts then we’ll already have these points. If it has 0 or 1 \(x\)-intercept we can either just plug in another \(x\) value or use the \(y\)-intercept and the axis of symmetry to get the second point.
- Sketch the graph. At this point we’ve gotten enough points to get a fairly decent idea of what the parabola will look like.
Now, there are two forms of the parabola that we will be looking at. This first form will make graphing parabolas very easy. Unfortunately, most parabolas are not in this form. The second form is the more common form and will require slightly (and only slightly) more work to sketch the graph of the parabola.
Let’s take a look at the first form of the parabola.
\[f\left( x \right) = a{\left( {x - h} \right)^2} + k\]There are two pieces of information about the parabola that we can instantly get from this function. First, if \(a\) is positive then the parabola will open up and if \(a\) is negative then the parabola will open down. Secondly, the vertex of the parabola is the point \(\left( {h,k} \right)\). Be very careful with signs when getting the vertex here.
So, when we are lucky enough to have this form of the parabola we are given the vertex for free.
Let’s see a couple of examples here.
- \(f\left( x \right) = 2{\left( {x + 3} \right)^2} - 8\)
- \(g\left( x \right) = - {\left( {x - 2} \right)^2} - 1\)
- \(h\left( x \right) = {x^2} + 4\)
Okay, in all of these we will simply go through the process given above to find the needed points and the graph.
a \(f\left( x \right) = 2{\left( {x + 3} \right)^2} - 8\) Show Solution
First, we need to find the vertex. We will need to be careful with the signs however. Comparing our equation to the form above we see that we must have \(h = - 3\) and \(k = - 8\) since that is the only way to get the correct signs in our function. Therefore, the vertex of this parabola is,
\[\left( { - 3, - 8} \right)\]Now let’s find the \(y\)-intercept. This is nothing more than a quick function evaluation.
\[f\left( 0 \right) = 2{\left( {0 + 3} \right)^2} - 8 = 2\left( 9 \right) - 8 = 10\hspace{0.25in}y - {\mbox{intercept : }}\left( {{\mbox{0,10}}} \right)\]Next, we need to find the \(x\)-intercepts. This means we’ll need to solve an equation. However, before we do that we can actually tell whether or not we’ll have any before we even start to solve the equation.
In this case we have \(a = 2\) which is positive and so we know that the parabola opens up. Also the vertex is a point below the \(x\)-axis. So, we know that the parabola will have at least a few points below the \(x\)-axis and it will open up. Therefore, since once a parabola starts to open up it will continue to open up eventually we will have to cross the \(x\)-axis. In other words, there are \(x\)-intercepts for this parabola.
To find them we need to solve the following equation.
\[0 = 2{\left( {x + 3} \right)^2} - 8\]We solve equations like this back when we were solving quadratic equations so hopefully you remember how to do them.
\[\begin{align*}2{\left( {x + 3} \right)^2} & = 8\\ {\left( {x + 3} \right)^2} & = 4\\ x + 3 & = \pm \sqrt 4 = \pm 2\\ x & = - 3 \pm 2\hspace{0.25in} \Rightarrow \hspace{0.25in}x = - 1,\,\,x = - 5\end{align*}\]The two x-intercepts are then,
\[\left( { - 5,0} \right)\hspace{0.25in}{\mbox{and}}\hspace{0.25in}\left( { - 1,0} \right)\]Now, at this point we’ve got points on either side of the vertex so we are officially done with finding the points. However, let’s talk a little bit about how to find a second point using the \(y\)-intercept and the axis of symmetry since we will need to do that eventually.
First, notice that the \(y\)-intercept has an \(x\) coordinate of 0 while the vertex has an \(x\) coordinate of -3. This means that the \(y\)-intercept is a distance of 3 to the right of the axis of symmetry since that will move straight up from the vertex.
Now, the left part of the graph will be a mirror image of the right part of the graph. So, since there is a point at \(y = 10\) that is a distance of 3 to the right of the axis of symmetry there must also be a point at \(y = 10\) that is a distance of 3 to the left of the axis of symmetry.
So, since the \(x\) coordinate of the vertex is -3 and this new point is a distance of 3 to the left its \(x\) coordinate must be -6. The coordinates of this new point are then \(\left( { - 6,10} \right)\). We can verify this by evaluating the function at \(x = - 6\). If we are correct we should get a value of 10. Let’s verify this.
\[f\left( { - 6} \right) = 2{\left( { - 6 + 3} \right)^2} - 8 = 2{\left( { - 3} \right)^2} - 8 = 2\left( 9 \right) - 8 = 10\]So, we were correct. Note that we usually don’t bother with the verification of this point.
Okay, it’s time to sketch the graph of the parabola. Here it is.

Note that we included the axis of symmetry in this graph and typically we won’t. It was just included here since we were discussing it earlier.
b \(g\left( x \right) = - {\left( {x - 2} \right)^2} - 1\) Show Solution
Okay with this one we won’t put in quite a much detail. First let’s notice that \(a = - 1\) which is negative and so we know that this parabola will open downward.
Next, by comparing our function to the general form we see that the vertex of this parabola is \(\left( {2, - 1} \right)\). Again, be careful to get the signs correct here!
Now let’s get the \(y\)-intercept.
\[g\left( 0 \right) = - {\left( {0 - 2} \right)^2} - 1 = - {\left( { - 2} \right)^2} - 1 = - 4 - 1 = - 5\]The \(y\)-intercept is then \(\left( {0, - 5} \right)\).
Now, we know that the vertex starts out below the \(x\)-axis and the parabola opens down. This means that there can’t possibly be \(x\)-intercepts since the \(x\) axis is above the vertex and the parabola will always open down. This means that there is no reason, in general, to go through the solving process to find what won’t exist.
However, let’s do it anyway. This will show us what to look for if we don’t catch right away that they won’t exist from the vertex and direction the parabola opens. We’ll need to solve,
\[\begin{align*}0 & = - {\left( {x - 2} \right)^2} - 1\\ {\left( {x - 2} \right)^2} & = - 1\\ x - 2 & = \pm \,i\\ x & = 2 \pm \,i\end{align*}\]So, we got complex solutions. Complex solutions will always indicate no \(x\)-intercepts.
Now, we do want points on either side of the vertex so we’ll use the \(y\)-intercept and the axis of symmetry to get a second point. The \(y\)-intercept is a distance of two to the left of the axis of symmetry and is at \(y = - 5\) and so there must be a second point at the same \(y\) value only a distance of 2 to the right of the axis of symmetry. The coordinates of this point must then be \(\left( {4, - 5} \right)\).
Here is the sketch of this parabola.

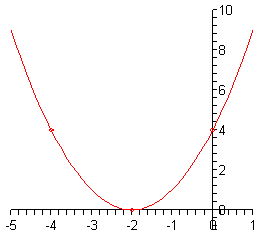
c \(h\left( x \right) = {x^2} + 4\) Show Solution
This one is actually a fairly simple one to graph. We’ll first notice that it will open upwards.
Now, the vertex is probably the point where most students run into trouble here. Since we have x2 by itself this means that we must have \(h = 0\) and so the vertex is \(\left( {0,4} \right)\).
Note that this means there will not be any \(x\)-intercepts with this parabola since the vertex is above the \(x\)-axis and the parabola opens upwards.
Next, the \(y\)-intercept is,
\[h\left( 0 \right) = {\left( 0 \right)^2} + 4 = 4\hspace{0.25in}y - {\mbox{intercept : }}\left( {0,4} \right)\]The \(y\)-intercept is exactly the same as the vertex. This will happen on occasion so we shouldn’t get too worried about it when that happens. Although this will mean that we aren’t going to be able to use the \(y\)-intercept to find a second point on the other side of the vertex this time. In fact, we don’t even have a point yet that isn’t the vertex!
So, we’ll need to find a point on either side of the vertex. In this case since the function isn’t too bad we’ll just plug in a couple of points.
\[\begin{align*}h\left( { - 2} \right) & = {\left( { - 2} \right)^2} + 4 = 8\hspace{0.25in} \Rightarrow \hspace{0.25in}\left( { - 2,8} \right)\\ h\left( 2 \right) & = {\left( 2 \right)^2} + 4 = 8\hspace{0.25in} \Rightarrow \hspace{0.25in}\left( {2,8} \right)\end{align*}\]Note that we could have gotten the second point here using the axis of symmetry if we’d wanted to.
Here is a sketch of the graph.

Okay, we’ve seen some examples now of this form of the parabola. However, as noted earlier most parabolas are not given in that form. So, we need to take a look at how to graph a parabola that is in the general form.
\[f\left( x \right) = a{x^2} + bx + c\]In this form the sign of \(a\) will determine whether or not the parabola will open upwards or downwards just as it did in the previous set of examples. Unlike the previous form we will not get the vertex for free this time. However, it is will easy to find. Here is the vertex for a parabola in the general form.
\[\left( { - \frac{b}{{2a}},f\left( { - \frac{b}{{2a}}} \right)} \right)\]To get the vertex all we do is compute the \(x\) coordinate from \(a\) and \(b\) and then plug this into the function to get the \(y\) coordinate. Not quite as simple as the previous form, but still not all that difficult.
Note as well that we will get the \(y\)-intercept for free from this form. The \(y\)-intercept is,
\[f\left( 0 \right) = a{\left( 0 \right)^2} + b\left( 0 \right) + c = c\hspace{0.25in} \Rightarrow \hspace{0.25in}\left( {0,c} \right)\]so we won’t need to do any computations for this one.
Let’s graph some parabolas.
- \(g\left( x \right) = 3{x^2} - 6x + 5\)
- \(f\left( x \right) = - {x^2} + 8x\)
- \(f\left( x \right) = {x^2} + 4x + 4\)
For this parabola we’ve got \(a = 3\), \(b = - 6\) and \(c = 5\). Make sure that you’re careful with signs when identifying these values. So we know that this parabola will open up since \(a\) is positive.
Here are the evaluations for the vertex.
\[\begin{align*}x & = - \frac{{ - 6}}{{2\left( 3 \right)}} = - \frac{{ - 6}}{6} = 1\\ y & = g\left( 1 \right) = 3{\left( 1 \right)^2} - 6\left( 1 \right) + 5 = 3 - 6 + 5 = 2\end{align*}\]The vertex is then \(\left( {1,2} \right)\). Now at this point we also know that there won’t be any \(x\)-intercepts for this parabola since the vertex is above the \(x\)-axis and it opens upward.
The \(y\)-intercept is \(\left( {0,5} \right)\) and using the axis of symmetry we know that \(\left( {2,5} \right)\) must also be on the parabola.
Here is a sketch of the parabola.

b \(f\left( x \right) = - {x^2} + 8x\) Show Solution
In this case \(a = - 1\), \(b = 8\) and \(c = 0\). From these we see that the parabola will open downward since \(a\) is negative. Here are the vertex evaluations.
\[\begin{align*}x & = - \frac{8}{{2\left( { - 1} \right)}} = - \frac{8}{{ - 2}} = 4\\ y & = f\left( 4 \right) = - {\left( 4 \right)^2} + 8\left( 4 \right) = 16\end{align*}\]So, the vertex is \(\left( {4,16} \right)\) and we also can see that this time there will be \(x\)-intercepts. In fact, let’s go ahead and find them now.
\[\begin{align*}0 & = - {x^2} + 8x\\ 0 & = x\left( { - x + 8} \right)\hspace{0.25in} \Rightarrow \hspace{0.25in}x = 0,\,\,x = 8\end{align*}\]So, the \(x\)-intercepts are \(\left( {0,0} \right)\) and \(\left( {8,0} \right)\). Notice that \(\left( {0,0} \right)\) is also the \(y\)-intercept. This will happen on occasion so don’t get excited about it when it does.
At this point we’ve got all the information that we need in order to sketch the graph so here it is,

c \(f\left( x \right) = {x^2} + 4x + 4\) Show Solution
In this final part we have \(a = 1\), \(b = 4\) and \(c = 4\). So, this parabola will open up.
Here are the vertex evaluations.
\[\begin{align*}x = - \frac{4}{{2\left( 1 \right)}} = - \frac{4}{2} = - 2\\ & y = f\left( { - 2} \right) = {\left( { - 2} \right)^2} + 4\left( { - 2} \right) + 4 = 0\end{align*}\]So, the vertex is \(\left( { - 2,0} \right)\). Note that since the \(y\) coordinate of this point is zero it is also an \(x\)-intercept. In fact it will be the only \(x\)-intercept for this graph. This makes sense if we consider the fact that the vertex, in this case, is the lowest point on the graph and so the graph simply can’t touch the \(x\)-axis anywhere else.
The fact that this parabola has only one \(x\)-intercept can be verified by solving as we’ve done in the other examples to this point.
\[\begin{align*}0 = {x^2} + 4x + 4\\ & 0 = {\left( {x + 2} \right)^2}\hspace{0.25in} \Rightarrow \hspace{0.25in}x = - 2\end{align*}\]Sure enough there is only one \(x\)-intercept. Note that this will mean that we’re going to have to use the axis of symmetry to get a second point from the \(y\)-intercept in this case.
Speaking of which, the \(y\)-intercept in this case is \(\left( {0,4} \right)\). This means that the second point is \(\left( { - 4,4} \right)\).
Here is a sketch of the graph.
As a final topic in this section we need to briefly talk about how to take a parabola in the general form and convert it into the form
\[f\left( x \right) = a{\left( {x - h} \right)^2} + k\]This will use a modified completing the square process. It’s probably best to do this with an example.
- \(f\left( x \right) = 2{x^2} - 12x + 3\)
- \(f\left( x \right) = - {x^2} + 10x - 1\)
Okay, as we pointed out above we are going to complete the square here. However, it is a slightly different process than the other times that we’ve seen it to this point.
a \(f\left( x \right) = 2{x^2} - 12x + 3\) Show Solution
The thing that we’ve got to remember here is that we must have a coefficient of 1 for the x2 term in order to complete the square. So, to get that we will first factor the coefficient of the x2 term out of the whole right side as follows.
\[f\left( x \right) = 2\left( {{x^2} - 6x + \frac{3}{2}} \right)\]Note that this will often put fractions into the problem that is just something that we’ll need to be able to deal with. Also note that if we’re lucky enough to have a coefficient of 1 on the x2 term we won’t have to do this step.
Now, this is where the process really starts differing from what we’ve seen to this point. We still take one-half the coefficient of \(x\) and square it. However, instead of adding this to both sides we do the following with it.
\[{\left( { - \frac{6}{2}} \right)^2} = {\left( { - 3} \right)^2} = 9\] \[f\left( x \right) = 2\left( {{x^2} - 6x + 9 - 9 + \frac{3}{2}} \right)\]We add and subtract this quantity inside the parenthesis as shown. Note that all we are really doing here is adding in zero since 9-9=0! The order listed here is important. We MUST add first and then subtract.
The next step is to factor the first three terms and combine the last two as follows.
\[f\left( x \right) = 2\left( {{{\left( {x - 3} \right)}^2} - \frac{{15}}{2}} \right)\]As a final step we multiply the 2 back through.
\[f\left( x \right) = 2{\left( {x - 3} \right)^2} - 15\]And there we go.
b \(f\left( x \right) = - {x^2} + 10x - 1\) Show Solution
Be careful here. We don’t have a coefficient of 1 on the x2 term, we’ve got a coefficient of -1. So, the process is identical outside of that so we won’t put in as much detail this time.
\[\begin{align*}f\left( x \right) & = - \left( {{x^2} - 10x + 1} \right)\hspace{0.25in}{\left( { - \frac{{10}}{2}} \right)^2} = {\left( { - 5} \right)^2} = 25\\ & = - \left( {{x^2} - 10x + 25 - 25 + 1} \right)\\ & = - \left( {{{\left( {x - 5} \right)}^2} - 24} \right)\\ & = - {\left( {x - 5} \right)^2} + 24\end{align*}\]