Section 2.3 : One-Sided Limits
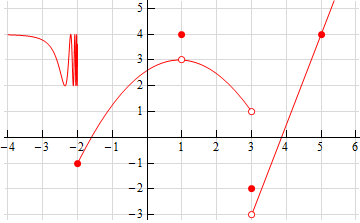
2. Below is the graph of \(f\left( x \right)\). For each of the given points determine the value of \(f\left( a \right)\), \(\mathop {\lim }\limits_{x \to {a^{\, - }}} f\left( x \right)\), \(\mathop {\lim }\limits_{x \to {a^{\, + }}} f\left( x \right)\), and \(\mathop {\lim }\limits_{x \to a} f\left( x \right)\). If any of the quantities do not exist clearly explain why.
- \(a = - 2\)
- \(a = 1\)
- \(a = 3\)
- \(a = 5\)
Show All Solutions Hide All Solutions
a \(a = - 2\) Show SolutionFrom the graph we can see that,
\[\require{bbox} \bbox[2pt,border:1px solid black]{{f\left( { - 2} \right) = - 1}}\]because the closed dot is at the value of \(y = - 1\).
We can also see that as we approach \(x = - 2\) from the left the graph is not approaching a single value, but instead oscillating wildly, and as we approach from the right the graph is approaching a value of -1. Therefore, we get,
\[\require{bbox} \bbox[4pt,border:1px solid black]{{\mathop {\lim }\limits_{x \to \, - {2^{\, - }}} f\left( x \right){\mbox{ does not exist}}\hspace{0.25in} \& \hspace{0.25in},\mathop {\lim }\limits_{x \to \, - {2^{\, + }}} f\left( x \right) = - 1}}\]Recall that in order for limit to exist the function must be approaching a single value and so, in this case, because the graph to the left of \(x = - 2\) is not approaching a single value the left-hand limit will not exist. This does not mean that the right-hand limit will not exist. In this case the graph to the right of \(x = - 2\) is approaching a single value the right-hand limit will exist.
Now, because the two one-sided limits are different we know that,
\[\require{bbox} \bbox[2pt,border:1px solid black]{{\mathop {\lim }\limits_{x \to \, - 2} f\left( x \right)\,\,{\mbox{does not exist}}}}\]b \(a = 1\) Show Solution
From the graph we can see that,
\[\require{bbox} \bbox[2pt,border:1px solid black]{{f\left( 1 \right) = 4}}\]because the closed dot is at the value of \(y = 4\).
We can also see that as we approach \(x = 1\) from both sides the graph is approaching the same value, 3, and so we get,
\[\require{bbox} \bbox[4pt,border:1px solid black]{{\mathop {\lim }\limits_{x \to \,{1^{\, - }}} f\left( x \right) = 3\hspace{0.25in}\& \hspace{0.25in}\mathop {\lim }\limits_{x \to \,{1^{\, + }}} f\left( x \right) = 3}}\]The two one-sided limits are the same so we know,
\[\require{bbox} \bbox[2pt,border:1px solid black]{{\mathop {\lim }\limits_{x \to \,1} f\left( x \right) = 3}}\]c \(a = 3\) Show Solution
From the graph we can see that,
\[\require{bbox} \bbox[2pt,border:1px solid black]{{f\left( 3 \right) = - 2}}\]because the closed dot is at the value of \(y = - 2\).
We can also see that as we approach \(x = 2\) from the left the graph is approaching a value of 1 and as we approach from the right the graph is approaching a value of -3. Therefore, we get,
\[\require{bbox} \bbox[4pt,border:1px solid black]{{\mathop {\lim }\limits_{x \to \,{3^{\, - }}} f\left( x \right) = 1\hspace{0.25in}\& \hspace{0.25in}\mathop {\lim }\limits_{x \to \,{3^{\, + }}} f\left( x \right) = - 3}}\]Now, because the two one-sided limits are different we know that,
\[\require{bbox} \bbox[2pt,border:1px solid black]{{\mathop {\lim }\limits_{x \to \,3} f\left( x \right)\,\,{\mbox{does not exist}}}}\]d \(a = 5\) Show Solution
From the graph we can see that,
\[\require{bbox} \bbox[2pt,border:1px solid black]{{f\left( 5 \right) = 4}}\]because the closed dot is at the value of \(y = 4\).
We can also see that as we approach \(x = 5\) from both sides the graph is approaching the same value, 4, and so we get,
\[\require{bbox} \bbox[4pt,border:1px solid black]{{\mathop {\lim }\limits_{x \to \,{5^{\, - }}} f\left( x \right) = 4\hspace{0.25in}\& \hspace{0.25in}\mathop {\lim }\limits_{x \to \,{5^{\, + }}} f\left( x \right) = 4}}\]The two one-sided limits are the same so we know,
\[\require{bbox} \bbox[2pt,border:1px solid black]{{\mathop {\lim }\limits_{x \to \,5} f\left( x \right) = 4}}\]