This course covers the standard topics from an Algebra course. We start by covering exponents, radicals and factoring so we have the basics down. We will learn how to solve linear, quadratic equations and inequalities as well as some applications of these techniques. In addition, we will introduce function notation, domains and ranges of functions, and finding roots of functions. We also examine graphs of lines, circles, parabolas, ellipses, hyperbolas, and transformations. Finally, we will look at exponential functions, logarithmic functions, solutions to exponential and logarithmic functions, and solving linear systems of equations with two or three variables.
In this course we will look at various techniques for finding solutions to differential equations. We will spend most of our time solving homogeneous and nonhomogeneous first and second order differential equations and learn how to extend these solution methods to higher order differential equations. We will learn how to apply Laplace transforms to solve differential equations and we will learn how to solve systems of linear differential equations. We finish off the course with some topics that are typically not covered in a differential equations course but are included for your knowledge. These are series solutions, boundary value problems, Fourier series and some introductory topics in solving partial differential equations.
This is a full set of material for all the topics that are traditionally covered in the Calculus I, Calculus II, and Calculus III courses. Limits, derivatives, and integrals for single variable functions and multi-variable functions are all covered and examples are worked and the solution process examined in detail. Applications of limits, derivatives and integrals are all examined and examples worked. Major theorems such as Intermediate Value Theorem, Mean Value Theorem, Fundamental Theorem of Calculus, Green’s Theorem, Stoke’s Theorem, and Divergence Theorem are covered and discussed. Practice problems with full solutions are included to reinforce a students understanding of the concepts and topics covered.
Calculus I covers limits, derivatives and basic integration. Calculus II covers advanced integration techniques, parametric equations, polar coordinates, series, vectors and 3D space. Calculus III covers 3D space, partial derivatives, double and triple integrals, line integrals, and surface integrals. Of course, applications are also presented where applicable.
Select the book to see a full listing of topics covered.
Below are summaries of the options available. Select an option on the left to access it.
Algebra Trig Review: This is a series of problems, with solutions, in selected topics in Algebra and Trigonometry that are vital for being successful in a Calculus course. The material presented here is intended to be a refresher for these topics and so does not go into great detail in the solutions outside of what is needed to remind you of the topics.
Common Math Errors: This is a series of errors and misconceptions that students in a math course will often run into. In most of the sections, the errors/misconceptions are presented in the incorrect form and the correct from. There will also be discussion about the error or misconception in most cases and what to watch out for so you don’t make the error/misconception. Most of the sections are accessible to anyone with some basic Algebra background. There are, however, some errors involving Trigonometry and Calculus.
Complex Number Primer: Many students never really see complex numbers and then are, all of a sudden, expected to know them. This quick primer is intended to introduce you to the basics of complex numbers as well as arithmetic involving complex numbers and some of the more common operations involving complex numbers. Hopefully, if you are in the situation of all of a sudden needing to know about complex numbers, this primer will give you all the information you need.
How To Study Math: This is a list of general tips on how to study and be successful in a math course. They have been broken down into distinct topics (taking notes, homework, exams, etc.). Every person is different so you may not find all of them useful but hopefully you can use this as a guide to determine what works for you in being successful in your math course.
Cheat Sheets and Tables: A series of cheat sheets and tables for quick reference. Topics include Algebra, Trigonometry, and Calculus. There are also tables for common derivatives and integrals as well as a table of Laplace transforms.
This is a series of problems, with solutions, in selected topics in Algebra and Trigonometry that are vital for being successful in a Calculus course. The material presented here is intended to be a refresher for these topics and so does not go into great detail in the solutions outside of what is needed to remind you of the topics.
For the function \(\displaystyle R\left( t \right) = \frac{{2 - \sqrt {{t^2} + 3} }}{{t + 1}}\) answer each of the following questions.
Evaluate the function at the following values of \(t\) compute (accurate to at least 8 decimal places).
-0.5
-0.9
-0.99
-0.999
-0.9999
-1.5
-1.1
-1.01
-1.001
-1.0001
Use the information from (a) to estimate the value of \(\displaystyle \mathop {\lim }\limits_{t \to \, - 1} \frac{{2 - \sqrt {{t^2} + 3} }}{{t + 1}}\).
For the function \(\displaystyle g\left( \theta\right) = \frac{{\sin \left( {7\theta } \right)}}{\theta }\) answer each of the following questions.
Evaluate the function at the following values of \(\theta \) compute (accurate to at least 8 decimal places). Make sure your calculator is set to radians for the computations.
0.5
0.1
0.01
0.001
0.0001
-0.5
-0.1
-0.01
-0.001
-0.0001
Use the information from (a) to estimate the value of \(\displaystyle \mathop {\lim }\limits_{\theta\to \,0} \frac{{\sin \left( {7\theta } \right)}}{\theta }\).
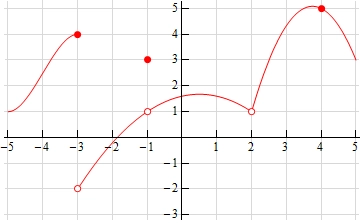
Below is the graph of \(f\left( x \right)\). For each of the given points determine the value of \(f\left( a \right)\) and \(\mathop {\lim }\limits_{x \to a} f\left( x \right)\). If any of the quantities do not exist clearly explain why.
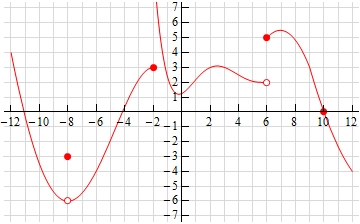
Below is the graph of \(f\left( x \right)\). For each of the given points determine the value of \(f\left( a \right)\) and \(\mathop {\lim }\limits_{x \to a} f\left( x \right)\). If any of the quantities do not exist clearly explain why.
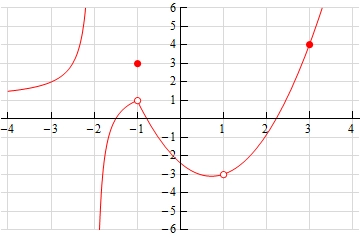
Below is the graph of \(f\left( x \right)\). For each of the given points determine the value of \(f\left( a \right)\) and \(\mathop {\lim }\limits_{x \to a} f\left( x \right)\). If any of the quantities do not exist clearly explain why.