Section 3.5 : Graphing Functions
1. Construct a table of at least 4 ordered pairs of points on the graph of the following function and use the ordered pairs from the table to sketch the graph of the function.
\[f\left( x \right) = {x^2} - 2\]Show All Steps Hide All Steps
Hint : By this time we’ve seen enough graphs of equations that we should be getting a feel for points to choose. However, if haven’t gotten a feel it yet try a selection of at least a couple of points to either side of zero (maybe even including zero).
For this function a selection of points on either side of zero should be sufficient to get an idea of what the graph of this function looks like. We’ll also include zero for no other reason that it will give an extra point on the graph.
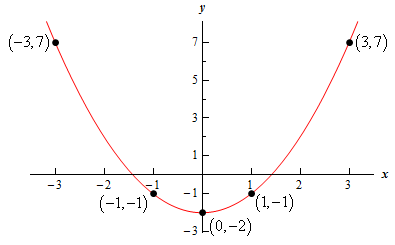
Here is the table of points we’ll use for this problem.
| \(x\) | \(f\left( x \right)\) | \(\left( {x,y} \right)\) |
|---|---|---|
| -3 | 7 | \(\left( { - 3,7} \right)\) |
| -1 | -1 | \(\left( { - 1, - 1} \right)\) |
| 0 | -2 | \(\left( {0, - 2} \right)\) |
| 1 | -1 | \(\left( {1, - 1} \right)\) |
| 3 | 7 | \(\left( {3,7} \right)\) |
Here is a sketch of the function.