Section 4.5 : The Shape of a Graph, Part I
8. For \(p\left( x \right) = \cos \left( {3x} \right) + 2x\) answer each of the following questions on \(\left[ { - {\displaystyle \frac{3}{2}},2} \right]\).
- Identify the critical points of the function.
- Determine the intervals on which the function increases and decreases.
- Classify the critical points as relative maximums, relative minimums or neither.
Show All Solutions Hide All Solutions
a Identify the critical points of the function. Show SolutionWe need the 1st derivative to get the critical points so here it is.
\[p'\left( x \right) = - 3\sin \left( {3x} \right) + 2\]Now, recall that critical points are where the derivative doesn’t exist or is zero. Clearly this derivative exists everywhere (the sine function exists everywhere….) and so all we need to do is set the derivative equal to zero and solve. We’re not going to show all of those details so if you need to do some review of the process go back to the Solving Trig Equations sections for some examples.
Here are all the critical points.
\[\begin{array}{*{20}{c}}{x = 0.2432 + \displaystyle \frac{2\pi}{3} n}\\{x = 0.8040 + \displaystyle \frac{2\pi}{3}n}\end{array}\hspace{0.25in}n = 0,\, \pm 1,\, \pm 2,\, \pm 3, \ldots \]Plugging in some \(n\)’s gives the following critical points in the interval \(\left[ { - {\frac{3}{2}},2} \right]\).
\[\require{bbox} \bbox[2pt,border:1px solid black]{{x = - 1.2904,\,\,\,\,\,\,\,x = 0.2432,\,\,\,\,\,\,\,x = 0.8040}}\]b Determine the intervals on which the function increases and decreases. Show Solution
To determine the increase/decrease information for the function all we need is a quick number line for the derivative. Here is the number line.
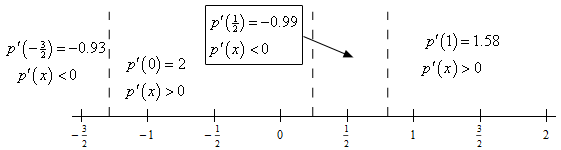
From this we get the following increasing/decreasing information for the function.
\[\require{bbox} \bbox[2pt,border:1px solid black]{\begin{align*}\,\,{\mbox{Increasing : }} & \left( { - 1.2904,0.2432} \right)\,\,\,\,\& \,\,\,\left( {0.8040,2} \right]\\ {\mbox{Decreasing : }}&\,\,\left[ { - {\frac{3}{2}}, - 1.2904} \right)\,\,\,\& \,\,\,\left( {0.2432,0.8040} \right)\end{align*}}\]Be careful with the end points of these intervals! We are working on the interval \(\left[ { - {\frac{3}{2}},2} \right]\) and we’ve done no work for increasing and decreasing outside of this interval and so we can’t say anything about what happens outside of the interval.
c Classify the critical points as relative maximums, relative minimums or neither. Show Solution
With the increasing/decreasing information from the previous step we can easily classify the critical points using the 1st derivative test. Here is classification of the functions critical points.
\[\require{bbox} \bbox[2pt,border:1px solid black]{\begin{align*}x & = - 1.2904\,\,\,\,\,\,:\,{\mbox{ Relative Minimum}}\\ x & = 0.2432\,\,\,\,\,\,\,\,\,:\,{\mbox{ Relative Maximum}}\\ x & = 0.8040\,\,\,\,\,\,\,\,\,:\,{\mbox{ Relative Minimum}}\end{align*}}\]As with the last step, we need to again recall that we are only working on the interval \(\left[ { - {\frac{3}{2}},2} \right]\)and the classifications given here are only for those critical points in the interval. There are, of course, an infinite number of critical points outside of this interval and they can all be classified as relative minimums or relative maximums provided we do the work to justify the classifications.