Section 6.1 : Exponential Functions
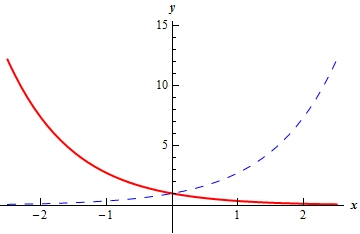
4. Sketch the graph of \(f\left( x \right) = {{\bf{e}}^{ - x}}\) .
Show Solution
For this problem all we need to do is recall the Transformations section from a couple of chapters ago. Using the “base” function of \(f\left( x \right) = {{\bf{e}}^x}\) the function for this part can be written as,
\[g\left( x \right) = {{\bf{e}}^{ - x}} = f\left( { - x} \right)\]Therefore, the graph for this part is just the graph of \(f\left( x \right)\) reflected about the \(y\)-axis.
The graph of this function is shown below. The blue dashed line is the “base” function, \(f\left( x \right)\), and the red solid line is the graph for this part, \(g\left( x \right)\).