Section 16.1 : Vector Fields
2. Sketch the vector field for \(\vec F\left( {x,y} \right) = \left( {y - 1} \right)\,\vec i + \left( {x + y} \right)\vec j\).
Show All Steps Hide All Steps
Start Solution
Recall that the graph of a vector field is simply sketching the vectors at specific points for a whole bunch of points. This makes sketching vector fields both simple and difficult. It is simple to compute the vectors and sketch them, but it is difficult to know just which points to pick and how many points to pick so we get a good sketch.
So, let’s start off with just computing some vectors at specific points.
\[\begin{align*}\vec F\left( {0, - 1} \right) & = - 2\,\vec i - \vec j & \hspace{0.5in}\vec F\left( {1,1} \right) & = 2\vec j & \hspace{0.5in}\vec F\left( { - 1,0} \right) & = - \,\vec i - \vec j\\ \vec F\left( { - 2, - 1} \right) & = - 2\,\vec i - 3\vec j& \hspace{0.5in}\vec F\left( {1, - 1} \right) & = - 2\,\vec i& \hspace{0.25in}\vec F\left( {2,2} \right) & = \,\vec i + 4\vec j\\ \vec F\left( { - 2,1} \right) & = - \vec j\end{align*}\]Show Step 2
Now we need to “sketch” each of these vectors at the point that generated them. For example at the point \(\left( {0, - 1} \right)\) we’ll sketch the vector \( - 2\vec i - \vec j\).
Here is the sketch of these vectors.
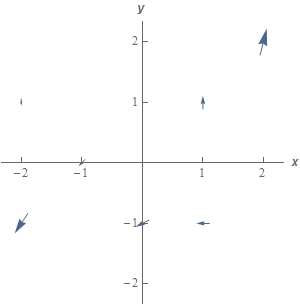
In the sketch above we didn’t sketch each of these vectors to scale. In other words we just sketched vectors in the same direction as the indicated vector rather than sketching the vector with “correct” magnitude. The reason for this is to keep the sketch a little easier to see. If we sketched all the vectors to scale we’d just see a mess of overlapping arrows that would be hard to really see what was going on.
Note as well that with the few vectors that we sketched it’s difficult to get a real feel for what is going on at any random point let along any trends in the vector field.
Show Step 3
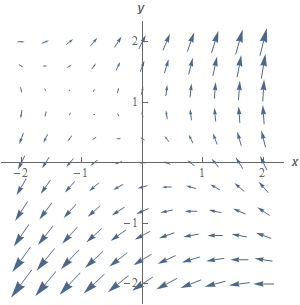
Below is a better sketch of the vector field with many more vectors sketched in. We got this sketch by letting a computer just plot quite a few points by itself without actually picking any of them as we did in the previous step.
In general, this is how vector fields are sketched. Computing this number of vectors by hand would so time consuming that it just wouldn’t be worth it. Computers however can do all those computations very quickly and so we generally just let them do the sketch.