Section 4.6 : Transformations
5. Use transformations to sketch the graph of the following function.
\[f\left( x \right) = - {x^3}\]Show All Steps Hide All Steps
Start Solution
Let’s first identify the “base” function (i.e. the function we are transforming). In this case it looks like we are transforming \(g\left( x \right) = {x^3}\) .
Show Step 2
The function that have here looks like it can be written as,
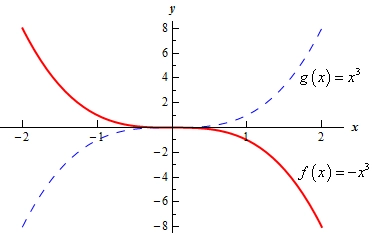
\[f\left( x \right) = - {x^3} = - g\left( x \right)\]Therefore, we can see that the graph of \(f\left( x \right)\) is simply going to be the graph of \(g\left( x \right)\) reflected about the \(x\)-axis.
Show Step 3
Here is a sketch of both the base function (blue dashed curve) and the function we were asked to graph (red solid curve).